The web UI freezes. git push hangs. A build that used to take 1:40 now takes 3:30. The runner VM looks idle in htop. The network is fine. It only happens while a pipeline is running.
The culprit isn’t your network or your runner. It’s the GitLab server hitting its RAM ceiling and swapping. A few default services eat more memory than most homelab boxes have to spare, and a Node-based pipeline is enough to tip the whole thing into swap.
This post is the playbook I used to diagnose and fix exactly that. Five-command diagnosis, three changes to gitlab.rb, build time back to 1:40.
Environment:
| Component | Value |
|---|---|
| GitLab | GitLab EE 18.9.1 (Omnibus, Debian) |
| Host | Debian 13 VM on Proxmox |
| VM Specs | 8 vCPU, 10 GB RAM, 60 GB SSD |
| Runner | Separate VM (Docker executor) |
| Workload | Astro static site → Cloudflare Pages |
The Workflow That Lands on the Server
Every time the symptoms hit, this is the path a single commit takes from your editor to a built artifact:

The compute happens on the runner VM, in a Docker container. But the server is in every step: it ingests the push, creates the pipeline, hands jobs to the runner, streams logs back, and stores the artifact. That’s why a server with no headroom collapses during pipelines even when the runner is idle.
What We’ll Cover
- Rule out the red herrings — TLS, DNS, runner contention
- Understand what GitLab is actually doing during a pipeline — Puma, Sidekiq, Workhorse, Postgres
- Diagnose in five commands — RAM, swap, load, OOM kills, disk
- Read real numbers from a thrashing box — what the symptoms look like
- Trim
gitlab.rb— Puma workers, Sidekiq concurrency, disable Prometheus/KAS - Grow swap as a safety net
- Verify the fix — what
free -handvmstatshould look like under load
What It’s Not
Before tuning anything, rule out three things that aren’t the problem:
| Suspect | Verdict | Why |
|---|---|---|
| TLS / HTTPS | Not the cause | TLS overhead is ~1–3% CPU. You’d see CPU pegged, not RAM exhausted. |
| Pi-hole / DNS routing | Not the cause | Slow DNS would slow everything, not just pipelines. Test with dig. |
| Runner / server contention | Not the cause | The runner already runs on a separate VM. If the runner VM is idle, it’s the server. |
If htop on the runner is idle and the GitLab VM is the slow one, you’re in the right place.
This post is about the GitLab server. If your pipelines are slow because the runner is taking the long way around (e.g. routing through Cloudflare instead of the local network), or if npm ci runs from scratch on every job, see GitLab Runner Performance Optimization. The two posts are complementary.
What Actually Happens on the Server During a Pipeline
Even with the runner on its own VM, the GitLab server still has work to do every time a job runs:
- Runner API polling. The runner hits
/api/v4/jobs/requestevery 3 seconds by default. Every poll goes through Puma. - Trace log streaming. As the job runs, the runner ships log output back continuously: Workhorse → Redis (
ci_build_trace_chunks) → Postgres. A noisy build (npm install is very noisy) means a lot of writes. - Sidekiq state machine. Every status change fires workers:
BuildTraceChunkFlushWorker,BuildFinishedWorker,PipelineUpdateWorker, and friends. - Artifact upload. At the end of the job, the runner pushes artifacts back through Workhorse.
On a 10 GB box running Puma + Sidekiq + Postgres + Redis + Gitaly + Workhorse + nginx + Prometheus + Registry + KAS + Pages, all of that lands on a system already at its memory ceiling. RAM pressure → swap → everything stalls.
Diagnose First
Run this block on the GitLab VM while a pipeline is actively running. Five commands, one minute, full picture.
free -h && echo "---" && vmstat 2 5
sudo gitlab-ctl status
top -b -n 1 -o %MEM | head -25
sudo dmesg -T | grep -iE 'oom|killed process' | tail -20
df -h && sudo du -sh /var/opt/gitlab/* | sort -h
How to read each:
| Command | Watch for | Verdict |
|---|---|---|
free -h | available close to zero, swap used | RAM ceiling hit |
vmstat 2 5 | si / so columns non-zero | Swap thrashing in progress |
gitlab-ctl status | Long list of services | Spot anything you don’t use (kas, registry, pages, prometheus) |
top -o %MEM | Top consumers | Tells you which knob to turn |
dmesg | Out of memory: Killed process … | Kernel killed a GitLab process — explains hangs |
df -h + du | /var/opt/gitlab/prometheus huge | Wasted disk on a service you may not need |
Also clarify the symptom before changing anything. Slow web UI, slow git push / git clone, or slow pipeline runtime? Each points at a different bottleneck — Puma for UI, Gitaly for git, the whole stack for pipelines.
Where the Pressure Goes

Every box on the server side holds memory. Add it up with the Omnibus defaults — Puma alone is 4×1.2 GB — and you’re at the ceiling before the pipeline even starts.
Real Numbers From a Thrashing Box
Here’s what the diagnostic block showed on my box during a slow pipeline:
Headline signals
| Signal | Value | Verdict |
|---|---|---|
| Free RAM | 207 MB / 10 GB | Critically low |
| Swap used | 1.0 GB / 1.0 GB (100%) | Completely full |
| Load avg (1/5/15) | 0.17 / 19.70 / 23.71 | System was crushed minutes ago |
| OOM kills | none | Swap absorbed it — which is why it feels slow |
| Disk usage | 28 / 59 GB (50%) | Fine |
/var/opt/gitlab/prometheus | 13 GB | Wasteful for a solo instance |
vmstat was quiet at sample time, but 5- and 15-minute load averages of 19 and 23 prove the storm just before. When swap is full, every new allocation stalls — that’s the felt slowness.
RAM breakdown from top
4 × Puma workers @ ~1.2 GB  = 4.8 GB   ← biggest consumer
1 × Sidekiq                 = 1.8 GB
1 × Puma master             = 0.7 GB
PostgreSQL (sum)            ~ 1.5 GB
Prometheus                  = 0.6 GB (+13 GB disk)
Gitaly                      = 0.2 GB
Redis, nginx, exporters     ~ 0.3 GB
                            ─────────
                            ~ 9.9 GB   right at the 10 GB ceiling
A 1–2 GB npm install during a CI job pushes the whole box into swap. That’s the root cause.
The full pre-fix snapshot
               total        used        free      shared  buff/cache   available
Mem:             9Gi       9.4Gi       419Mi       2.2Gi       2.6Gi       539Mi
Swap:          1.0Gi       1.0Gi       412Ki
---
procs -----------memory---------- ---swap-- -----io---- -system-- -------cpu-------
 r  b   swpd   free   buff  cache   si   so    bi    bo   in   cs us sy id wa st gu
 0  0 1048160 429860  33120 2712088    6    4  7253   272 1307    2  1  1 97  1  0  0
Swap fully used (1048160 KB), available RAM at 539 MB. Anything new has to evict pages to disk first.
And the full service list — many of which I never use:
run: alertmanager: …
run: gitaly: …
run: gitlab-exporter: …
run: gitlab-kas: …
run: gitlab-workhorse: …
run: logrotate: …
run: nginx: …
run: node-exporter: …
run: postgres-exporter: …
run: postgresql: …
run: prometheus: …
run: puma: …
run: redis: …
run: redis-exporter: …
run: sidekiq: …
Alertmanager, node-exporter, postgres-exporter, redis-exporter, prometheus, gitlab-kas — six processes I haven’t touched in months, all holding memory.
The Fix
Apply in order. Step 1 alone is usually enough.
Step 1 — Trim gitlab.rb
Edit /etc/gitlab/gitlab.rb:
# Cut Puma from 4 workers to 2. Frees ~2.4 GB.
puma['worker_processes'] = 2

# Sidekiq default is 20; 10 is plenty for a solo instance.
sidekiq['max_concurrency'] = 10

# Frees ~600 MB RAM + lets you reclaim 13 GB of disk afterwards.
prometheus_monitoring['enable'] = false

# Disable only if you're not using the Kubernetes Agent.
gitlab_kas['enable'] = false

# Disable only if you're not using these.
registry['enable']     = false
gitlab_pages['enable'] = false
Apply and restart:
sudo gitlab-ctl reconfigure
sudo gitlab-ctl restart
Only after Prometheus has actually stopped (verify with gitlab-ctl status), reclaim its disk:
sudo rm -rf /var/opt/gitlab/prometheus/dataRun sudo gitlab-ctl status | grep prometheus first and confirm no run: entries remain. Deleting /var/opt/gitlab/prometheus/data while the service is still running corrupts the in-flight write batch.
Step 2 — Grow swap to 4 GB (safety net, not a cure)
Swap doesn’t make a thrashing box fast. It does prevent OOM kills, which turn slow into broken.
sudo swapoff -a
sudo fallocate -l 4G /swapfile
sudo chmod 600 /swapfile
sudo mkswap /swapfile
sudo swapon /swapfile
echo '/swapfile none swap sw 0 0' | sudo tee -a /etc/fstab
Step 3 — Grow the VM (when convenient)
If you can bump RAM 10 → 16 GB in Proxmox, do it. That alone removes the constraint and lets you re-enable Prometheus or KAS without thinking about budget.
| Resource | Current | Recommended |
|---|---|---|
| RAM | 10 GB | 16 GB |
| Swap | 1 GB | 4 GB |
| Disk | 60 GB | 60 GB (fine after Prometheus cleanup) |
Verify the Fix
Restart, then re-run the diagnostic block. The state to want:
si/soinvmstatstay at 0 under pipeline loadavailableRAM stays above 1–2 GB- Load average stays well below CPU count (8)
Here’s the after on my box, with no pipeline running:
               total        used        free      shared  buff/cache   available
Mem:             9Gi       5.0Gi       4.0Gi       208Mi       1.4Gi       4.9Gi
Swap:          1.0Gi        25Mi       998Mi
RAM use dropped from 9.4 GB to 5.0 GB. Swap dropped from 100% used to ~2%. There’s now 4 GB of headroom for a pipeline to chew through without touching disk.
Under pipeline load:
procs -----------memory---------- ---swap-- -----io---- -system-- -------cpu-------
 r  b   swpd   free   buff  cache   si   so    bi    bo   in   cs us sy id wa st gu
 1  0  25692 3456384  86496 1725492    6    4  7795   271 1320    2  1  1 97  1  0  0
 0  0  25692 3443544  86500 1725492    0    0     0    40 1143 1123  2  0 97  0  0  0
 0  0  25692 3442508  86500 1725492    0    0     0     0 1086 1165  2  0 98  0  0  0
si and so flat at 0 across every 2-second sample. No swap I/O. That’s what “not thrashing” looks like.
Build and deploy time for the staging/production pipeline:
| Phase | Before | After |
|---|---|---|
| Build + deploy | 03:30 | 01:40 |
Nearly 2× faster, with one config file edit and no hardware change.
The pipeline history makes the difference impossible to miss. Before the fix, pipeline durations were all over the map — some runs took 3, 4, even 9 minutes:

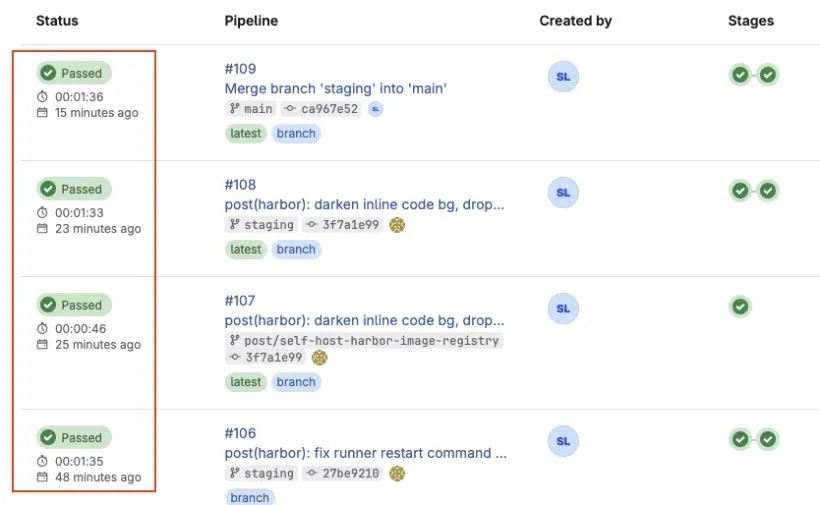
After the fix, every recent pipeline lands in the 1:30–1:40 range — predictable, no outliers:
Decision Tree — When to Apply What
Not every slow GitLab has the same shape. Match the symptom to the fix:
| Symptom in diagnostic block | Likely cause | Apply |
|---|---|---|
si / so non-zero in vmstat | RAM exhaustion → swap | Step 1 (trim gitlab.rb) or grow RAM to 16 GB |
Puma processes dominate top | Too many Puma workers for the box | puma['worker_processes'] = 2 |
Sidekiq + Postgres dominate top | Trace log noise + state churn | Step 1 + quieter CI logs (set NPM_CONFIG_LOGLEVEL=error) |
| Gitaly dominates | Big repo or slow disk | Check repo size, check Proxmox storage I/O |
Disk near full, /var/opt/gitlab huge | Old artifacts, traces, registry | Clean old job traces, expire artifacts, prune the registry |
| No RAM/CPU stress, just slow web UI | Puma worker count mismatch | puma['worker_processes'] = 2 |
| Cloudflare-routed traffic, runner idle, server healthy | Network detour | See GitLab Runner Performance Optimization |
What You Have Now
| Layer | Outcome |
|---|---|
| Server | RAM use down from 9.4 GB to 5.0 GB. 4 GB of headroom for pipelines. |
| Services | Prometheus, KAS, Registry, Pages disabled (re-enable when you actually need them) |
| Disk | 13 GB reclaimed from /var/opt/gitlab/prometheus |
| Pipeline | 03:30 → 01:40 with no hardware change |
| Safety | 4 GB swap so a runaway job slows things down instead of OOM-killing Puma |
Next Steps
- GitLab Runner Performance Optimization — the runner-side counterpart. Direct internal connections, Docker executor tuning, caching,
needsfor parallelism. - Self-Host Harbor Image Registry on Debian — stop hitting Docker Hub on every CI job. Smaller base-image pulls = less Workhorse traffic = less server load.
- Monitoring Proxmox with Grafana — the diagnostic block in this post is reactive. A Grafana dashboard watching RAM and swap on the GitLab VM will surface this trend a week before it becomes “the pipeline is broken.”
- Linux Server Security Baseline — once the GitLab server is performing, lock it down.